
The methods used to analyze securities and make investment decisions fall into two very broad categories: Fundamental Analysis and Technical Analysis. Fundamental analysis involves analyzing the characteristics of a company in order to estimate its value. Technical analysis takes a completely different approach; it doesn't care one bit about the "value" of a company or a commodity. Technicians (sometimes called chartists) are only interested in the price movements in the market.
Technical Analysis is the forecasting of future financial price movements based on an examination of past price movements. Like weather forecasting, technical analysis does not result in absolute predictions about the future. Instead, technical analysis can help investors anticipate what is "likely" to happen to prices over time. Technical analysts believe that the historical performance of stocks and markets are indications of future performance.
Despite all the fancy and exotic tools it employs, technical analysis really just studies supply and demand in a market in an attempt to determine what direction, or trend, will continue in the future. In other words, technical analysis attempts to understand the emotions in the market by studying the market itself, as opposed to its components.

We mean Business.We also give you PROFIT
Focus on Price
If the objective is to predict the future price, then it makes sense to focus on price movements. Price movements usually precede fundamental developments. By focusing on price action, technicians are automatically focusing on the future. The market is thought of as a leading indicator and generally leads the economy by 6 to 9 months. To keep pace with the market, it makes sense to look directly at the price movements. More often than not, change is a subtle beast. Even though the market is prone to sudden knee-jerk reactions, hints usually develop before significant moves. A technician will refer to periods of accumulation as evidence of an impending advance and periods of distribution as evidence of an impending decline.
Supply, Demand, and Price Action
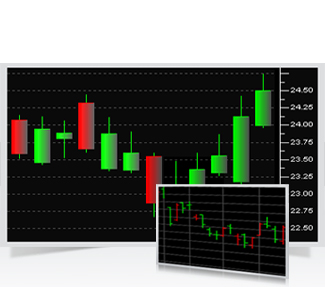
Many technicians use the open, high, low and close when analyzing the price action of a security. There is information to be gleaned from each bit of information. Separately, these will not be able to tell much. However, taken together, the open, high, low and close reflect forces of supply and demand.
The annotated example above shows a stock that opened with a gap up. Before the open, the number of buy orders exceeded the number of sell orders and the price was raised to attract more sellers. Demand was brisk from the start. The intraday high reflects the strength of demand (buyers). The intraday low reflects the availability of supply (sellers). The close represents the final price agreed upon by the buyers and the sellers. In this case, the close is well below the high and much closer to the low. This tells us that even though demand (buyers) was strong during the day, supply (sellers) ultimately prevailed and forced the price back down. Even after this selling pressure, the close remained above the open. By looking at price action over an extended period of time, we can see the battle between supply and demand unfold. In its most basic form, higher prices reflect increased demand and lower prices reflect increased supply.
Support/Resistance
Simple chart analysis can help identify support and resistance levels. These are usually marked by periods of congestion (trading range) where the prices move within a confined range for an extended period, telling us that the forces of supply and demand are deadlocked. When prices move out of the trading range, it signals that either supply or demand has started to get the upper hand. If prices move above the upper band of the trading range, then demand is winning. If prices move below the lower band, then supply is winning.
Pictorial Price History
Even if you are a tried and true fundamental analyst, a price chart can offer plenty of valuable information. The price chart is an easy to read historical account of a security's price movement over a period of time. Charts are much easier to read than a table of numbers. On most stock charts, volume bars are displayed at the bottom. With this historical picture, it is easy to identify the following:
Technical analysis can help with timing a proper entry point. Some analysts use fundamental analysis to decide what to buy and technical analysis to decide when to buy. It is no secret that timing can play an important role in performance. Technical analysis can help spot demand (support) and supply (resistance) levels as well as breakouts. Simply waiting for a breakout above resistance or buying near support levels can improve returns.
It is also important to know a stock's price history. If a stock you thought was great for the last 2 years has traded flat for those two years, it would appear that Wall Street has a different opinion. If a stock has already advanced significantly, it may be prudent to wait for a pullback. Or, if the stock is trending lower, it might pay to wait for buying interest and a trend reversal.
If the objective is to predict the future price, then it makes sense to focus on price movements. Price movements usually precede fundamental developments. By focusing on price action, technicians are automatically focusing on the future. The market is thought of as a leading indicator and generally leads the economy by 6 to 9 months. To keep pace with the market, it makes sense to look directly at the price movements. More often than not, change is a subtle beast. Even though the market is prone to sudden knee-jerk reactions, hints usually develop before significant moves. A technician will refer to periods of accumulation as evidence of an impending advance and periods of distribution as evidence of an impending decline.
Supply, Demand, and Price Action
Many technicians use the open, high, low and close when analyzing the price action of a security. There is information to be gleaned from each bit of information. Separately, these will not be able to tell much. However, taken together, the open, high, low and close reflect forces of supply and demand.
The annotated example above shows a stock that opened with a gap up. Before the open, the number of buy orders exceeded the number of sell orders and the price was raised to attract more sellers. Demand was brisk from the start. The intraday high reflects the strength of demand (buyers). The intraday low reflects the availability of supply (sellers). The close represents the final price agreed upon by the buyers and the sellers. In this case, the close is well below the high and much closer to the low. This tells us that even though demand (buyers) was strong during the day, supply (sellers) ultimately prevailed and forced the price back down. Even after this selling pressure, the close remained above the open. By looking at price action over an extended period of time, we can see the battle between supply and demand unfold. In its most basic form, higher prices reflect increased demand and lower prices reflect increased supply.
Support/Resistance
Simple chart analysis can help identify support and resistance levels. These are usually marked by periods of congestion (trading range) where the prices move within a confined range for an extended period, telling us that the forces of supply and demand are deadlocked. When prices move out of the trading range, it signals that either supply or demand has started to get the upper hand. If prices move above the upper band of the trading range, then demand is winning. If prices move below the lower band, then supply is winning.
Pictorial Price History
Even if you are a tried and true fundamental analyst, a price chart can offer plenty of valuable information. The price chart is an easy to read historical account of a security's price movement over a period of time. Charts are much easier to read than a table of numbers. On most stock charts, volume bars are displayed at the bottom. With this historical picture, it is easy to identify the following:
- Reactions prior to and after important events.
- Past and present volatility.
- Historical volume or trading levels<.
- Relative strength of a stock versus the overall market.
Technical analysis can help with timing a proper entry point. Some analysts use fundamental analysis to decide what to buy and technical analysis to decide when to buy. It is no secret that timing can play an important role in performance. Technical analysis can help spot demand (support) and supply (resistance) levels as well as breakouts. Simply waiting for a breakout above resistance or buying near support levels can improve returns.
It is also important to know a stock's price history. If a stock you thought was great for the last 2 years has traded flat for those two years, it would appear that Wall Street has a different opinion. If a stock has already advanced significantly, it may be prudent to wait for a pullback. Or, if the stock is trending lower, it might pay to wait for buying interest and a trend reversal.